研究方法
Fission Track Dating
The sample preparation and experimental processes follow the methods of Liu et al. (2000, 2001). We used grain by grain and mica external detector techniques to obtain individual grain ages (Wagner and Van Den Haute, 1992). Zeta values (Green, 1985; Hurford and Green, 1983) for the standard glasses CN-5 (apatite) and SRM-610 (zircon) were 340 ± 12 (1σ) and 27.5 ± 1.0 (1σ), respectively. Neutron irradiation was carried out at the National Tsing Hua University Reactor of Taiwan. Errors were calculated using the conventional analysis given by Green (1981).
Liu, T.K., Chen, Y.G., Chen, W.S., and Jiang, S.H., 2000, Rates of cooling and denudation of the early Penglai orogeny, Taiwan, as assessed by fission-track constraints: Tectonophysics, v. 320, p. 69–82, doi: 10 .1016 /S0040 -1951 (00)
Liu, T.K., Hsieh, S., Chen, Y.G., and Chen, W.S., 2001, Thermokinematic evolution of the Taiwan oblique-collision mountain belt as revealed by zircon fission track dating:
Earth and Planetary Science Letters, v. 186, p. 45–56, doi: 10 .1016 /S0012 -821X (01)00232 -1. 00028-7.
Wagner, G., and Van den Haute, P., 1992, Fission track dating: Dordrecht, Kluwer, 285 p.
Green, P.F., 1985, Comparison of zeta calibration baselines for fission-track dating of apatite, zircon and sphene: Chemical Geology, v. 58, p. 1–22, doi: 10 .1016 /0168 -9622 (85) 90023 -5.
Hurford, A.J., and Green, P.F., 1983, The zeta calibration of fission track dating: Isotope Geoscience, v. 1, p. 285–317, doi: 10 .1016 /S0009 -2541 (83)80026 -6.
Green, P.F., 1981, ‘Track-in-track’ length measurements in annealed apatites: Nuclear Tracks, v. 5, p. 121–128, doi: 10 .1016 /0191 -278X (81)90034 -2.
From: https://www.researchgate.net/publication/317011926
U-Th-Pb Dating
The zircons were analyzed by the LA–ICP–MS technique following essentially the methods described by Chiu et al. (2009). We used an Agilent 7500s quadrupole ICP–MS equipped with a New Wave UP213 laser ablation system that is housed at the Department of Earth and Environmental Sciences of the Chung Cheng University, Taiwan.
Laser ablation was performed using a helium carrier gas resulting in reduced deposition of ablated material onto the sample surface and improved transport efficiency, and thus increased the signal intensities. During the experiments, the gas blank was measured for about 60 s and the results indicate sensitivities of less than 1000 counts per second (cps) for all measured isotopes. The signals were measured for about 70 s. Calibration was performed using the GJ-1 zircon standard (provided by NTU) that is well established for its precise 207Pb/206Pb age and an intercept age using isotope-dilution thermal ionization mass spectrometry (ID-TIMS) at 608.5 ± 0.4 Ma (2r) and 608.5 ± 1.5 Ma (2r), respectively (Jackson et al., 2004).
All U–Th–Pb isotope ratios were calculated using the GLITTER 4.4.2 (GEMOC) software, and common lead was corrected using the common lead correction function proposed by Andersen (2002). Calculation of weighted mean U–Pb ages probability density curves as well as the plotting of concordia plots were carried out using Isoplot v. 3.0 (Ludwig, 2003).
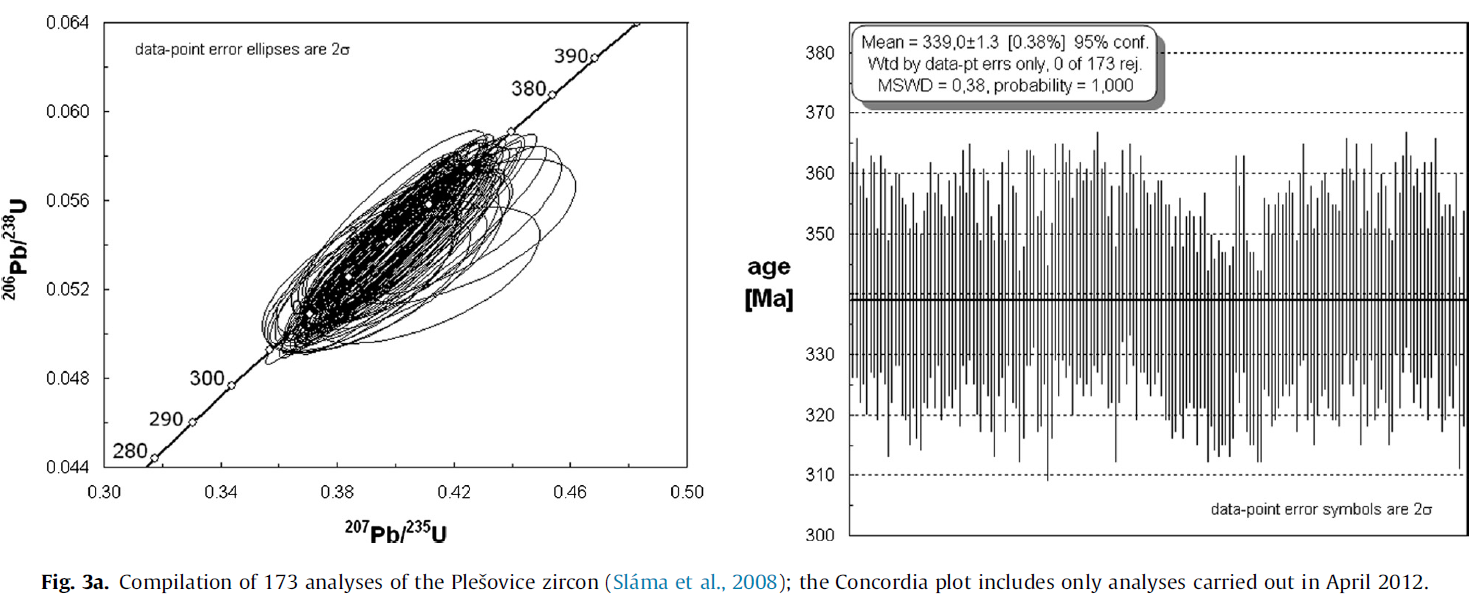
Each run started and ended with at least two analyses of the GJ-standard. The accuracy of the analyses was checked by analyzing the Plešovice zircon (Slama et al., 2008) at the start of each set. The accepted age for this zircon is 337.1 Ma (ID-TIMS) and LA-ICPMS data obtained in different laboratories varies from 335 ± 1 Ma to 339 ± 2 Ma (Slama et al., 2008). If the value for the Plešovice zircon was found to be unsatisfactory, the run was restarted by re-calibration of GJ. During the general period of study, an average age of 339.0 ± 1.3 Ma (MSWD = 0.39) was obtained based on 173 analyses (Fig. 3a) excluding analyses that were not accepted and led to re-calibration of the system; inclusion of rejected data gives an virtually identical average age of 339.6 ± 1.2 Ma; MSWD = 0.89).
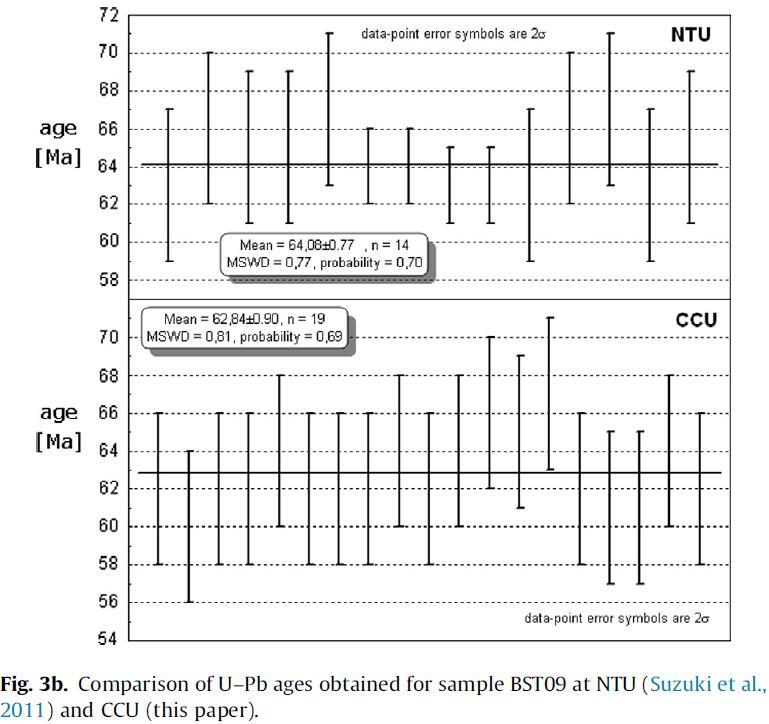
In order to further establish the accuracy of the system, sample BST05, a rhyolitic tuff from the Heilongjian River area in northern China (Suzuki et al., 2011) was analyzed. Though not ideal as a standard, because of the presence of xenocrysts and old components in some zircons, this tuff is particularly well suited to test the accuracy of our data, as its age is constrained by paleontological evidence to be of Danian (lowermost Paleocene, 61.7 ± 0.3– 66 ± 0.3 Ma). Previously, zircons from this tuff were analyzed by Li et al. (2004) and Suzuki et al. (2011) who reported ages of 65.5 ± 1.0 Ma (omitting two discordant analyses and one analysis with a large error; Li et al., 2004) and 64.1 ± 0.8 Ma (MSWD = 0.71, n = 15; Suzuki et al., 2011). Re-analysis of the sample used by Suzuki et al. (2011) gave an average age of 62.8 ± 0.9 Ma (n = 19, MSWD = 0.8) which, within errors, is indistinguishable from the previously obtained age and is clearly a Danian age. Using Ludwig’s (2003) ‘zircon age extractor’, we find likewise find a close match for the data (given the errors): 64 + 2/_1 Ma for the data of Suzuki et al. (2011) and 62 + 2/_0 Ma for our new data (Fig. 3b).
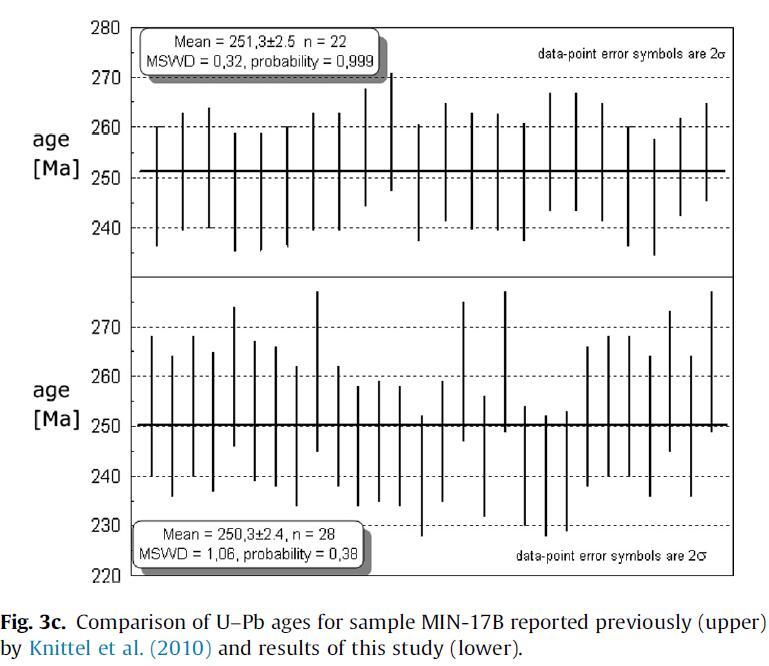
Furthermore, the Camarong Gneiss that is exposed on Mindoro Island in the Philippines that was previously dated by Knittel et al. (2010) was re-analyzed. The age of 250.3 ± 2.4 Ma (MSWD = 1.06, n = 28) obtained is in good agreement with the previously reported age of 251.3 ± 2.5 Ma (MSWD = 0.32, n = 22; Knittel et al., 2010; see Fig. 3c). We discuss 206Pb/238U ages for grains younger than 1 Ga and 207Pb/206Pb ages for grains older than 1 Ga.
Chiu, H., Chung, S., Wu, F., Liu, D., Liang, Y., Lin, I., Iizuka, Y., Xie, L., Wang, Y., Chu, M., 2009. Zircon U-Pb and Hf isotopic constraints from eastern Transhimalayan batholiths on the precollisional magmatic and tectonic evolution in southern Tibet. Tectonophysics 477, 3–19.
Jackson, S.E., Pearson, N.J., Griffin, W.L., Belousova, E.A., 2004. The application of laser ablation-inductively coupled plasma-mass spectrometry to in situ U-Pb zircon geochronology. Chem. Geol. 211, 47–69.
Andersen, T., 2002. Correction of common lead in U-Pb analyses that do not report 204Pb. Chem. Geol. 192, 59–79.
Ludwig, K.R., 2003. Isoplot v. 3.0: A Geochronological Toolkit for Microsoft Excel. Berkeley Geochronology Center.
Sláma, J., Kosler, J., Condon, D.J., Crowley, J.L., Gerdes, A., Hanchar, J.M., Horstwood, M.S.A., Morris, G.A., Nasdala, L., Norberg, N., Schaltegger, U., Schoene, B., Tubrett, M.N., Whitehouse, M.J., 2008. Plesovice zircon – a new natural reference material for U-Pb and Hf isotopic microanalysis. Chem. Geol. 249, 1–35.
Suzuki, S., Sun, G., Knittel, U., Danhara, T., Iwano, H., 2011. Radiometric zircon ages of a tuff sample from the Baishantou member of Wuyun formation, Jiayin: a contribution to the search for the K-T Boundary in Heilongjian River Area, China. Acta Geol. Sinica 85, 1351–1358.
Li, X., Li, W., Chen, P., Wan, X., Li, G., Song, B., Jiang, J., Liu, J., Yin, D., Yan, W., 2004. SHRIMP U-Pb zircon dating of the uppermost cretaceous furao formation near the Heilong River: An age closest to the K/T boundary. Chin. Sci. Bull. 49, 860–862.
Ludwig, K.R., 2003. Isoplot v. 3.0: A Geochronological Toolkit for Microsoft Excel. Berkeley Geochronology Center.
Knittel, U., Hung, C.-H., Yang, T.F., Iizuka, Y., 2010. Permian arc magmatism in Mindoro, the Philippines: an early Indosinian event in the Palawan Continental Terrane. Tectonophysics 493, 113–117.
From: https://www.sciencedirect.com/science/article/pii/S1367912014003897
Raman spectroscopy
Spectroscopy and light
Light interacts with matter in different ways, transmitting through some materials, while reflecting or scattering off others. Both the material and the colour (wavelength) of the light affect this interaction. We call the study of this light ‘spectroscopy’. Which parts of the visible spectrum enter our eyes determines which colours we perceive.
A substance might appear blue, for example, if it absorbs the red parts of the spectrum of light falling upon it, only reflecting (or scattering) the blue parts into our eyes.
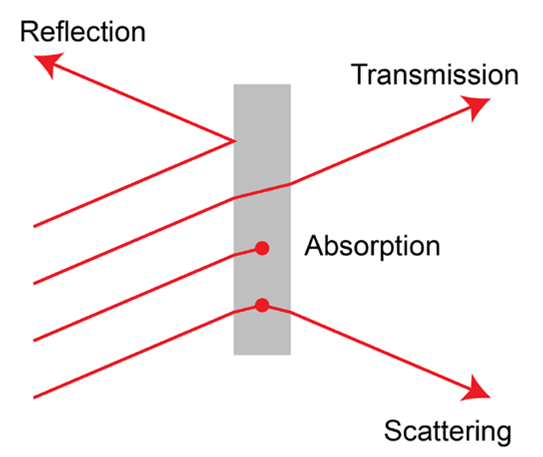
The different fundamental light processes during material interaction
Raman spectroscopy looks at the scattered light
If you were to shine blue light—from just one part of the spectrum—onto the material, you might expect to just see blue light reflected from it, or no light at all if it is completely absorbed (i.e. a black material).
However, by using a Raman spectrometer, you can see that often a very tiny fraction of the scattered light has a different colour. It has changed frequency because, during the scattering process, its energy changed by interacting with molecular vibrations. This is the Raman scattering process, named after its discoverer, the famous Indian physicist C.V. Raman. He was awarded the 1930 physics Nobel Prize for this great discovery.
A basic overview of Raman spectroscopy
By studying the vibration of the atoms we can discover the chemical composition and other useful information about the material.
The Raman effect is very weak; only about 1 part in 10 million of the scattered light has a shifted colour. This is too weak to see with the naked eye, so we analyse the light with a highly sensitive spectrometer.
Raman spectrometers
These systems consist of:
one or more single coloured light sources (lasers)
lenses (both to focus the light onto the sample and to collect the scattered light)
filters (to purify the reflected and scattered light so that only the Raman light is collected)
a means of splitting the light into its constituent colours (normally a diffraction grating or prism)
a very sensitive detector (to detect the weak light)
a device such as a computer to control the whole system, display the spectrum and enable this information to be analysed
Raman scattering offers significant advantages for the investigation of materials over other analytical techniques, such as x-raying them or seeing how they absorb light (e.g. infrared absorption or ultraviolet absorption).
What do the Raman bands represent?
It is easy to understand the Raman spectrum of crystals with a regular array of identical atoms, all in the same configuration (such as the carbon atoms in diamond). In these cases, you often see just one dominant Raman band (because there is just one molecular environment of the crystal).
The Raman spectrum of polystyrene, however, is much more complex because the molecule is less symmetric and has hydrogen atoms in addition to carbon atoms. There are also different bond types connecting the atoms.
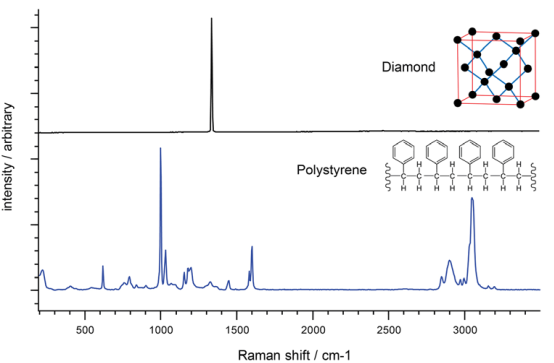
Raman spectra of diamond and polystyrene
From: http://www.utekinco.com.tw/